Dutchess County NY July 2021 Home Sales rose significantly
Dutchess County NY Real Estate
JFIVE Homes Realty LLC
A Review of Dutchess County NY July 2021 home sales
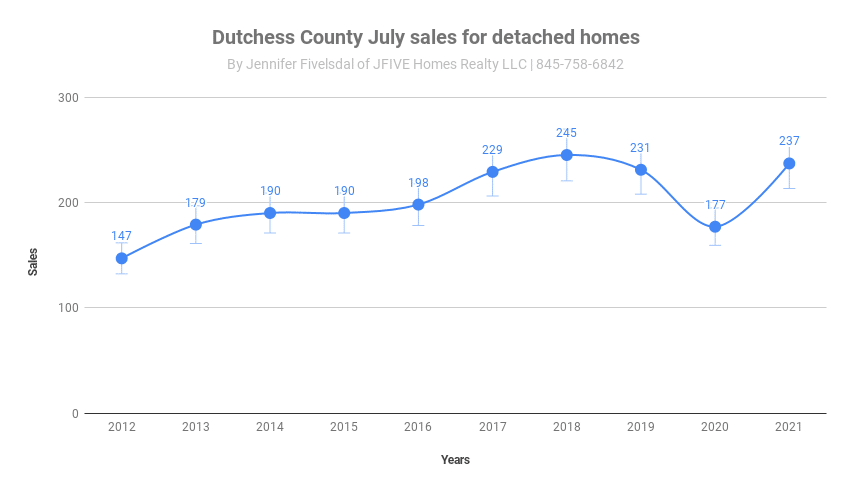
Dutchess County NY July 2021 home sales of single-family detached homes rose 33.9 percent to 237 when compared to 177 for July 2020. The homes sold were priced between $115,000 and $3,900,000, built between 1728 and 2021 with square footage ranging from 728 to 6133.
An average sale price of $486,094 was an increase of 8.1 percent over the $449,741 recorded last July.
The median sale price at $385,000 was up 23.2 percent over the $310,000 for the same time last year.

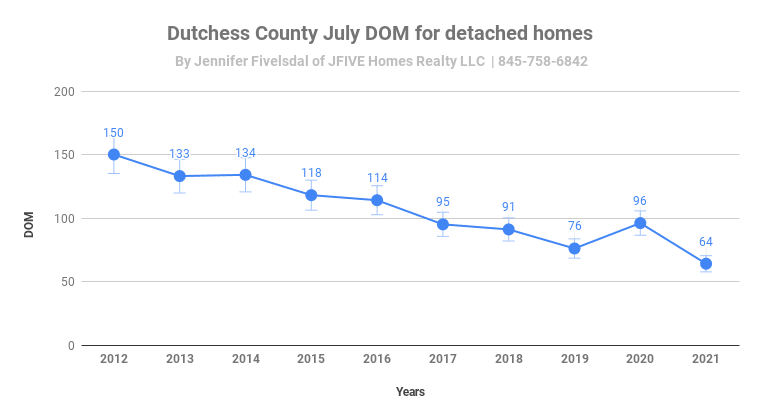
Home sold faster this July, the days on market fell 33.3 percent to 64 days compared to 96 in July 2020.
Inventory fell 34.9 percent to 635 when compared to 976 at the same time last year.
Purchase offers at the beginning of the month increased by 22.4 percent. Last July there were 246 and 301 for this July.
The absorption rate at 2.68 months was less than the 5.51 recorded last July.
Comparison of Dutchess County NY July 2021 home sales to July 2020 (Detached homes)
|
Data considered |
July 20 |
June 21 |
July 21 |
|
Avg. Price |
$ 449,741 |
$ 499,855 |
$486,094 |
|
Median Price |
$ 332,800 |
$ 405,000 |
$ 410,000 |
|
# of Sales |
177 |
233 |
237 |
|
Days on Market |
96 |
61 |
64 |
|
Inventory |
976 |
852 |
635 |
|
Absorption rate |
5.51 |
2.80 |
2.68 |
|
Purchase offer |
246 |
309 |
301 |
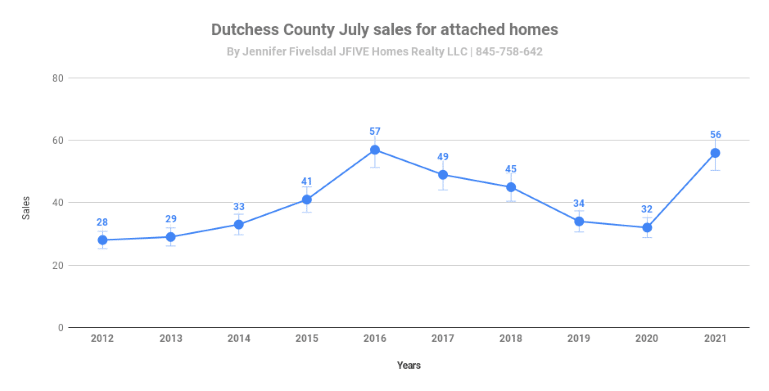
Attached home market sales (condos, townhouses, and coop) rose 75 percent going from 32 in July 2020 to 56 this July, these homes ranged in price from $ 35,000 to $932,000. Built between 1820 and 2020 these homes had square footage from 610 to 3,933.
The average sale price increased by 4.7 percent to $284,254 compared to $271,493 last July.
On the other hand, the median price fell 14.7 percent to $236,000 when compared to $276,750 last July.

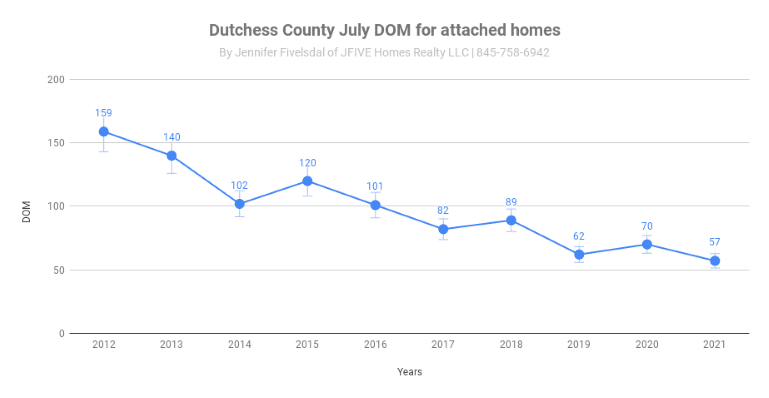
Days on market fell 18.6 percent to 56 days for Dutchess County NY July 2021 home sales from 70 last July.
There was a 28 percent decrease in the inventory,113 units this July versus 157 at the same time last year.
Purchase offers on the other hand rose 80 percent to 72 from 40 in July 2020
The absorption rate at 2.01 months was down from the 4.90 months in July 2020
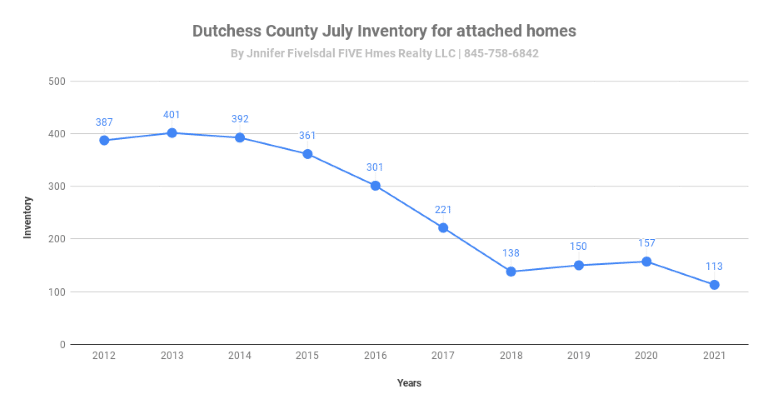
Comparison of home sales in July ( attached homes)
|
Data considered |
July 20 |
June 21 |
July 21 |
|
Avg. Price |
$271,493 |
$328,769 |
$284,254 |
|
Median Price |
$276,750 |
$285,000 |
$236,000 |
|
# of Sales |
32 |
84 |
56 |
|
Days on Market |
70 |
58 |
57 |
|
Inventory |
157 |
157 |
113 |
|
Absorption rate |
4.9 |
2.45 |
2.01 |
|
Purchase offer |
40 |
58 |
72 |
Data used to prepare this market report was obtained from the Mid Hudson Multiple Listing Services.




No Comments