Dutchess County NY home sales in January 2021 up over forty percent.
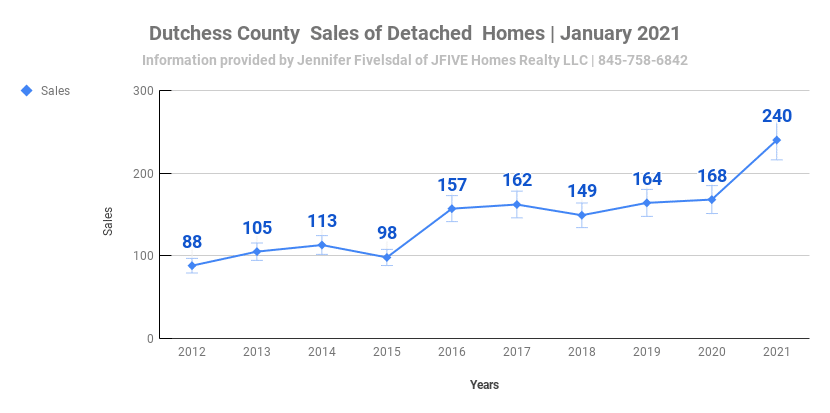
Dutchess County NY home sales in January 2021 showed 240 single-family detached homes sold, which was an increase of 42.9 percent when compared to the 168 homes sold during the same time last year. Homes sold this January ranged from $ 103,000 to $ 7,000,000 and were built between 1799 and 2020 with square footage from 616 to 7.654.
The graph below shows this January had the highest number of sales for the period 2012-2021.
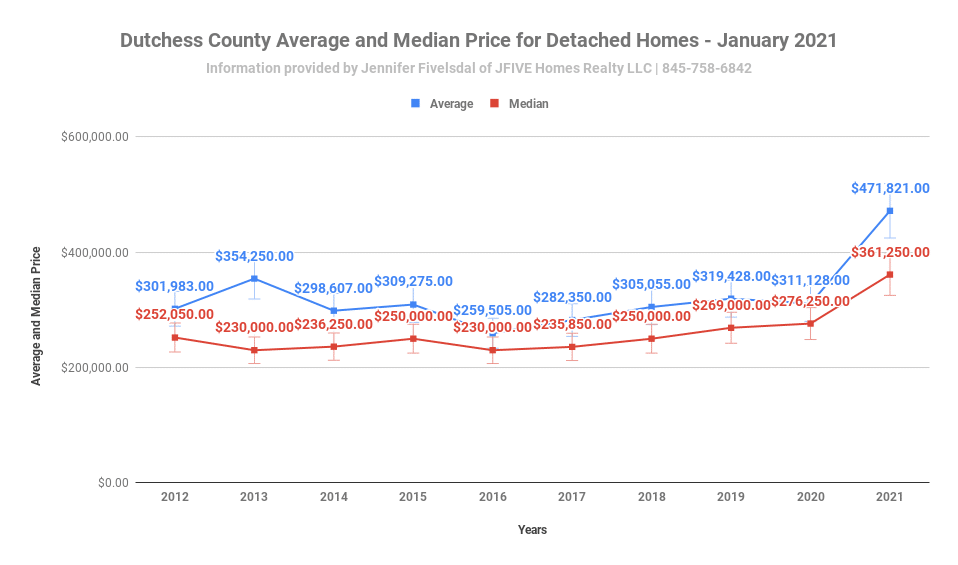
At $ 471,821 the average sale price was up 51.6 percent over January 2020 when the average price was $ 311,128. The average sale price was affected by the 12 million dollar sales.
A median price at $ 361,250 was an increase of 30.8 percent over the median for the same time last year, back then the median was $ 276,250.
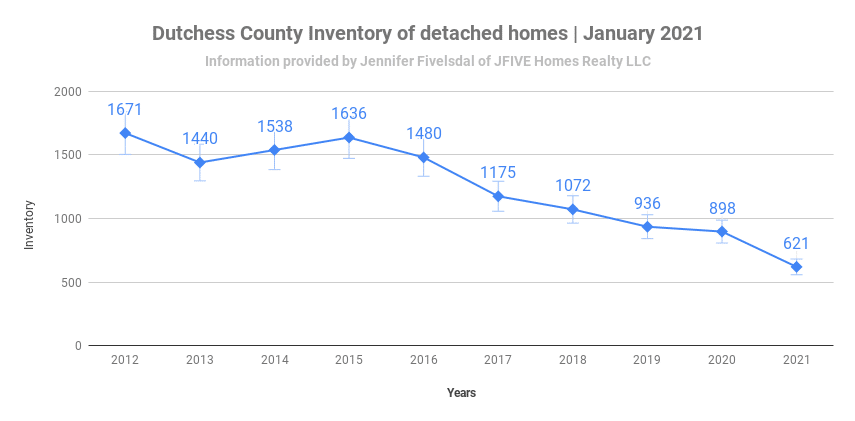
621 was the inventory count this January which was 30.8 percent lower than last January. At that time the inventory was 898. This January’s inventory was the lowest inventory for the period 2012-2021.
The absorption rate (the time it would take to work off the present inventory) came in at 2.59 months.
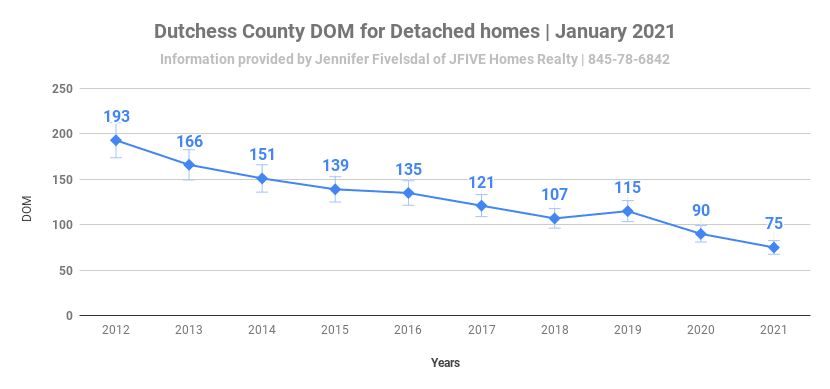
Days on market fell 16.7 percent compared to the same time in 2020. The average days on market was 75 this January and 90 in January 2020.
Homes are selling faster and in many cases there are multiple offers.
Comparison Dutchess County home sales January 2021 to 2020
|
Data considered |
Jan. 2020 |
Dec . 2020 |
Jan. 2021 |
|
Avg. Price |
$311,128 |
$ 440,105 |
$471,821 |
|
Median Price |
$276,250 |
$369,000 |
$361,250 |
|
# of Sales |
168 |
357 |
240 |
|
Days on Market |
90 |
75 |
75 |
|
Inventory |
898 |
861 |
621 |
|
Absorption rate |
5.34 |
2.41 |
2.59 |
|
Purchase offer |
125 |
342 |
250 |
Sales of attached homes
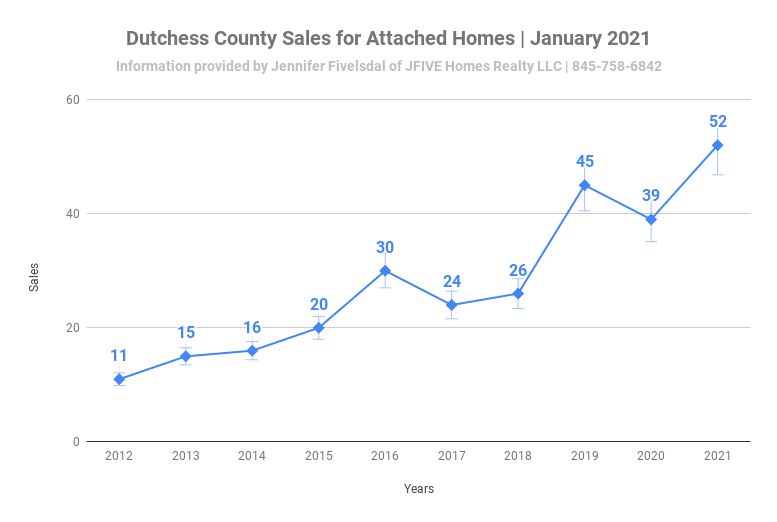
Dutchess County NY home sales in January 2021 update for attached homes (Coops, Condos, and townhouses) showed an increase in unit sales of 33.3 percent, going from 39 in January 2020 to 52 this January. Units sold ranged in price from $ 83,000 to $ 1,350,000. These units were built between 1962 and 2020 with square footage from 660 to 4,200.
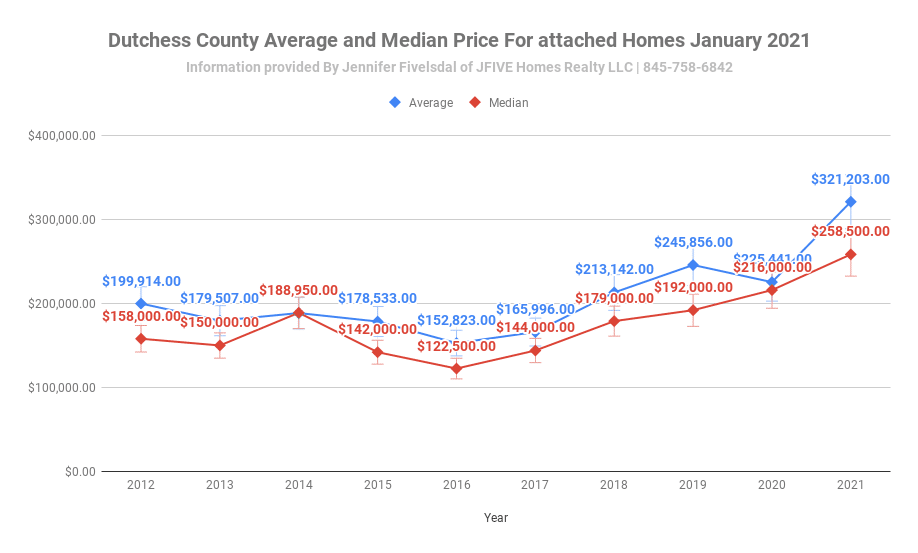
The average sale price, when compared to January 2020, rose 42.5 percent. This year the average sale price came in at $ 321,203 compared to $225,441 the same time in 2020. The median price increased by 19.7 percent to $258,500 compared to $216,000 in January 2020.
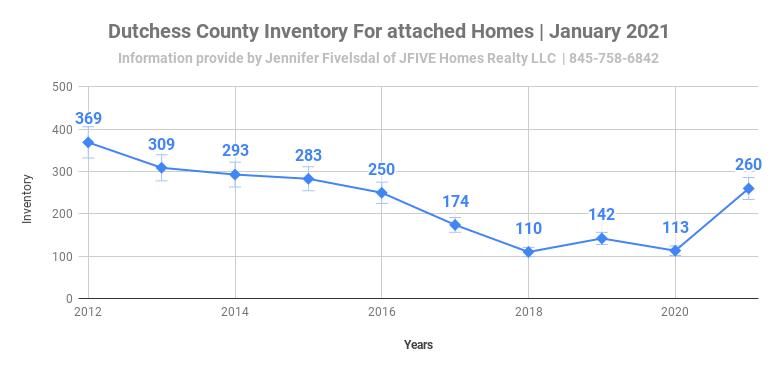
The attached market inventory at 260 was an increase of 130.1 percent over an inventory of 113 for the same time last year.
The absorption rate of 5 months ( the time it would take to work off the present inventory) was an increase over the 2.90 months in January 2020 due to the increase in the inventory.
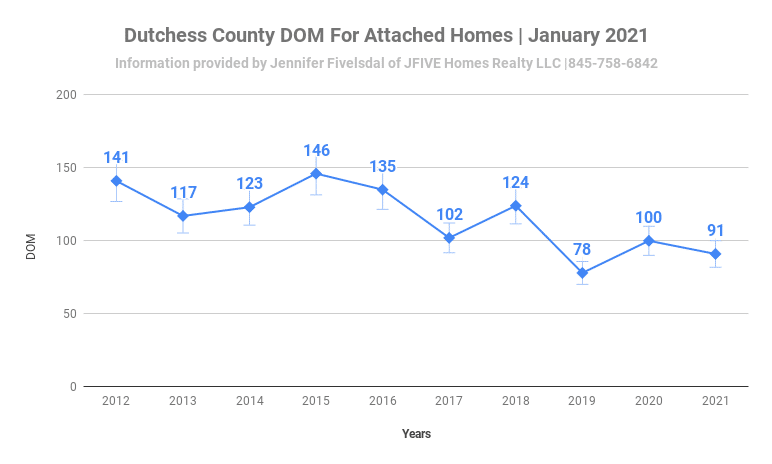
Days on market this January was 91 compared to 100 the same time in 2020, a drop of 9.0 percent.
Comparison of attached home sales
|
Data considered |
Jan. 2020 |
Dec. 2020 |
Jan. 2021 |
|
Avg. Price |
$225,441 |
$270,304 |
$321,203 |
|
Median Price |
$216,000 |
$238,500 |
$258,500 |
|
# of Sales |
39 |
60 |
52 |
|
Days on Market |
100 |
84 |
91 |
|
Inventory |
113 |
157 |
260 |
|
Absorption rate |
2.90 |
2.61 |
5 |
|
Purchase offer |
25 |
58 |
47 |
***Data used in this report was obtained from the Mid Hudson MLS
If you are a homeowner thinking of selling your home now is a great time to do so. Home value has risen, the inventory is low and mortgage rates are also very low which also benefits home buyers.
Call Today to discuss your real estate needs
Jennifer Fivelsdal – Real Estate Broker- JFIVE Homes Realty LLC. 845-594-99477- jennifer@jfivehomes.com


No Comments