Dutchess County NY home sales in August 2021 fell so did the inventory
Market update for Dutchess County NY home sales in August 2021
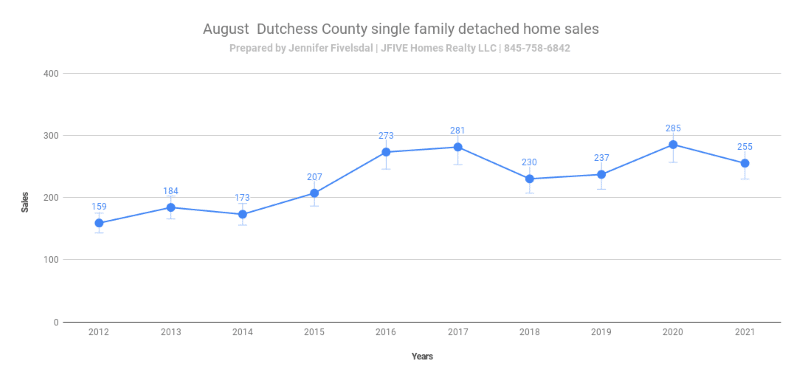
The Dutchess County NY home sales in August 2021 of single-family detached homes fell 10.5 percent, going from 285 in August 2020 to 255 this August. Homes sold during the month ranged in price from $ 111,000 to $ 3,850.000, built between 1785 and 2020 with square feet from 350 to 7549. There were thirteen transactions over a million dollars.
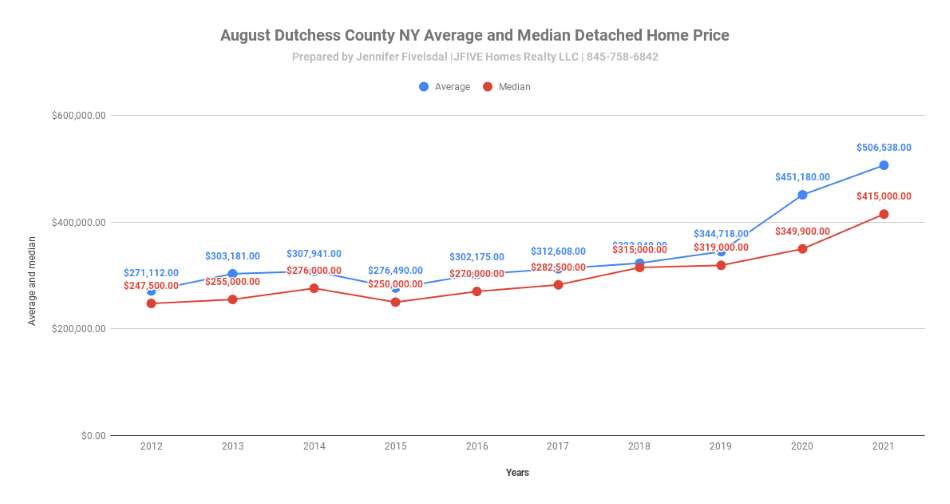
At $506,538 the average sale price rose 12.3 percent over last August when the average sale price was $451,180.
A median sale price of $415,000 this August was up 18.6 percent over the same time last year when the median was $349,900.
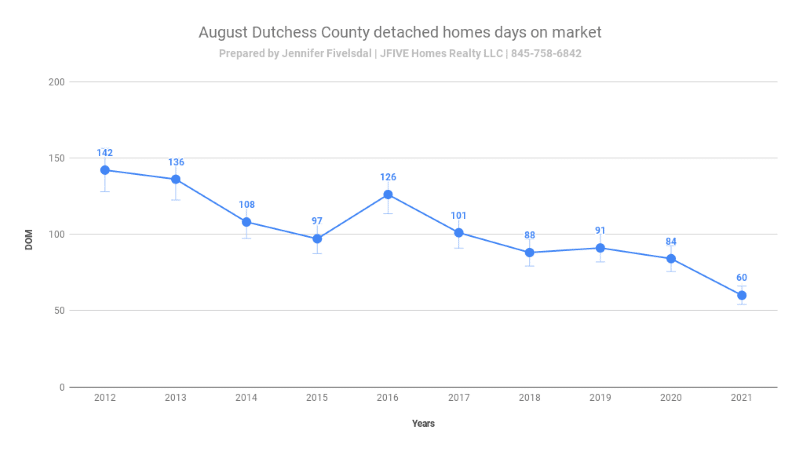
Homes were on the market fewer days this August. At 60 the decline was 28.6 percent compared to 84 days last August.
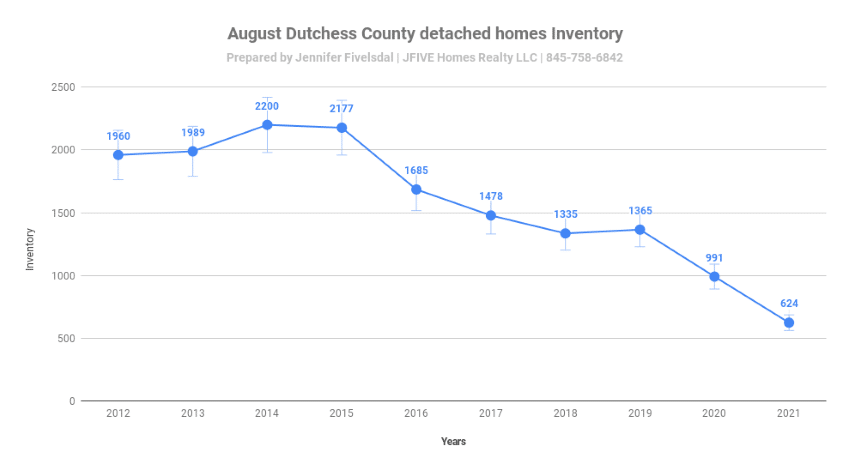
Inventory continues to decline, at 624 this August it was down 37 percent when compared to an inventory of 991 in August 2020
Purchase offers decreased by 10.3 percent going from 319 in August 2020 to 286 this August.
The absorption rate (the time it would take to work off the present inventory) came in at 2.45 months compared to 3.48 months last August.
Comparison Dutchess County NY home sales in August (Detached homes)
|
Data considered |
August 20 |
July 21 |
August 21 |
|
Avg. Price |
$451,180 |
$486,094 |
$506,538 |
|
Median Price |
$349,900 |
$410,000 |
$415,000 |
| # Of sales | 285 |
237 |
255 |
|
Days on Market |
84 |
64 |
60 |
|
Inventory |
991 |
635 |
624 |
|
Absorption rate |
3.48 |
2.68 |
2.45 |
|
Purchase offer |
319 |
309 |
286 |
Real estate market update for attached homes
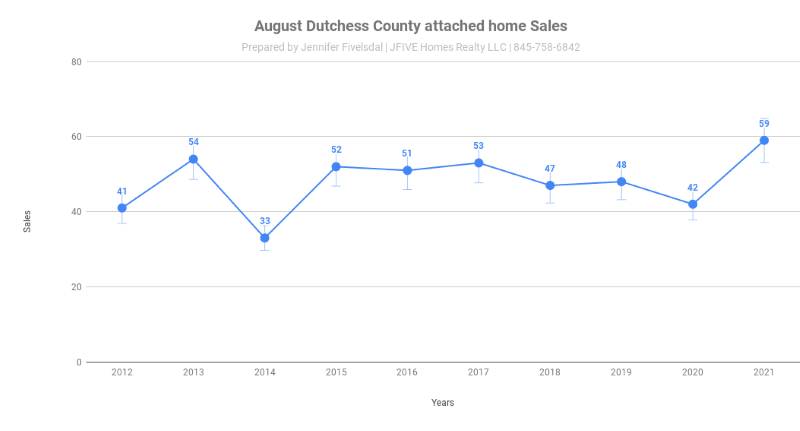
Dutchess County NY homes sales in August 2021 for attached homes (Coops, Condos, and townhouses) rose 40.5 percent when compared to August 2020 at that time there were 42 sales versus 59 this August. The units sold ranged in price from $ 50,000 to $1,150,000. These units were built between 1912 and 2020 with square feet from 500 to 3,515.
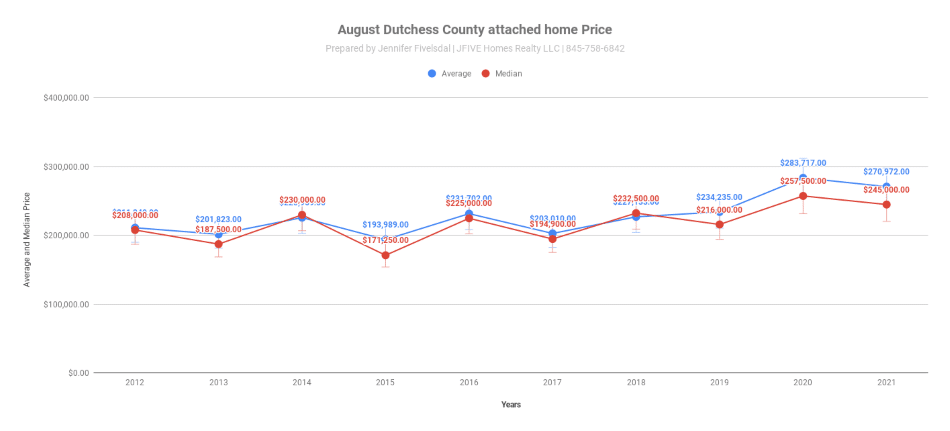
An average sale price of $270,972 fell 4.5 percent compared to the $283,717 recorded in August 2020. However, the July 2021 sale price came in at $284,254.
A median sale price of $245,000 was a decrease of 4.9 percent less than the median price of $257,500 last August.
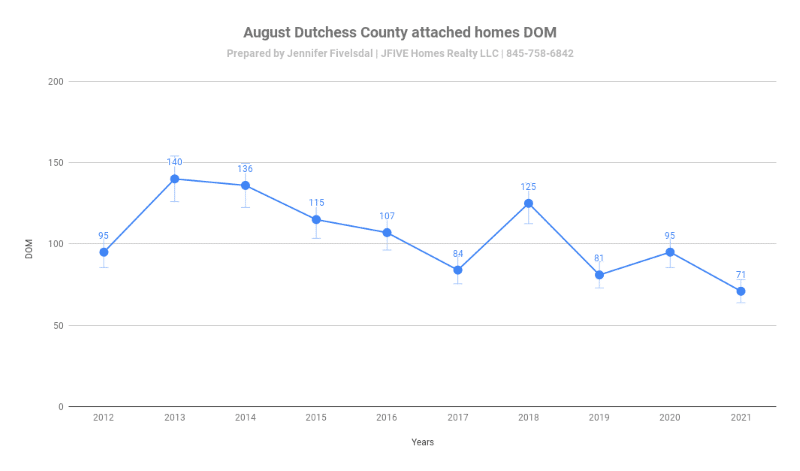
Days on market at 71 fell 25.3 percent when compared to the 95 days for last August.
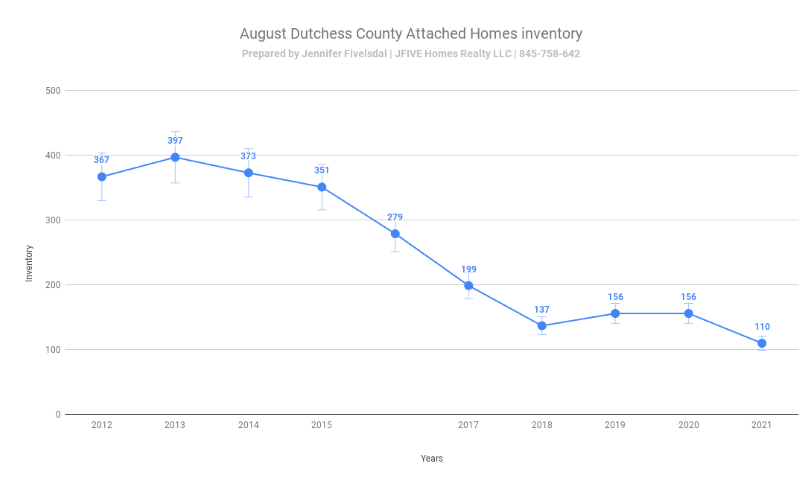
Inventory at 110 fell 29.5 percent this August when compared to the 156 for August 2020.
Purchase offers at 68 was an increase of 41.7 percent over the 48 offers recorded last August.
The absorption rate at 1.86 months was down from the 3.71 months in August 2020 ( the time it would take to work off the present inventory)
Home sales comparison for attached homes
|
Data considered |
August 20 |
July 21 |
August 21 |
|
Avg. Price |
$283,717 |
$284,254 |
$270,972 |
|
Median Price |
$257,500 |
$236,000 |
$ 245,000 |
|
# of Sales |
42 |
56 |
59 |
|
Days on Market |
95 |
57 |
71 |
|
Inventory |
156 |
113 |
110 |
|
Absorption rate |
3.71 |
2.01 |
1.86 |
|
Purchase offer |
48 |
72 |
68 |
If you have a real estate need please call or text Jennifer Fivelsdalat | Real Estate Broker | JFIVE Homes Realty LLC| at 845-594-9947
Data used in this report was obtained from the Mid Hudson MLS. Information deemed reliable but not guaranteed.


No Comments